Summary:
Building a dashboard and create individual pages for each plot and a means by which it can navigate between them. These pages will contain the visualizations and their corresponding explanations. It will also have a landing page, a page where it can see a comparison of all of the plots, and another page where it can view the data used to build them
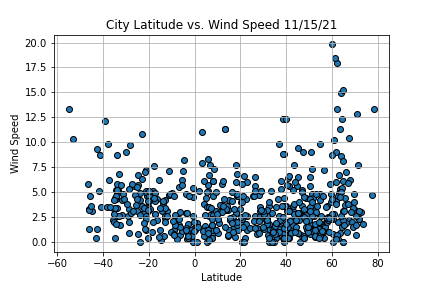
Visualizations


